Design Custom Gauges and Progress Indicators in Your Browser
The Themely Gauge Builder started with a very practical problem: we needed better gauges.
While working on system monitoring dashboards—especially for tools like InfoPanel—we kept running into the same limitation. Stock images were too generic, and custom design work was slow and inflexible. We wanted gauges that fit our layouts, our data, and our style—without going back and forth with a designer every time something changed.
So we built a tool that lets you create exactly that.
The Gauge Builder runs entirely in your browser. You design the gauge visually, tweak it until it feels right, and export a complete animation that's ready to drop straight into your project. Although it was originally made for system monitoring, the output works just as well in games, web apps, videos, presentations, or anywhere you need a clear visual indicator.
What Is the Gauge Builder?
At its core, the Gauge Builder is a visual editor for animated data indicators.
It was designed with system monitoring in mind—CPU load, temperatures, memory usage, network activity—but it doesn't stop there. Any situation where you need to show progress, levels, or changing values can benefit from it.
There's nothing to install. You adjust settings, see the result instantly, and download the finished animation when you're done. No design software, no plugins, no complicated setup.
What You Can Build
The builder includes five different gauge types, each suited to different kinds of data and layouts.
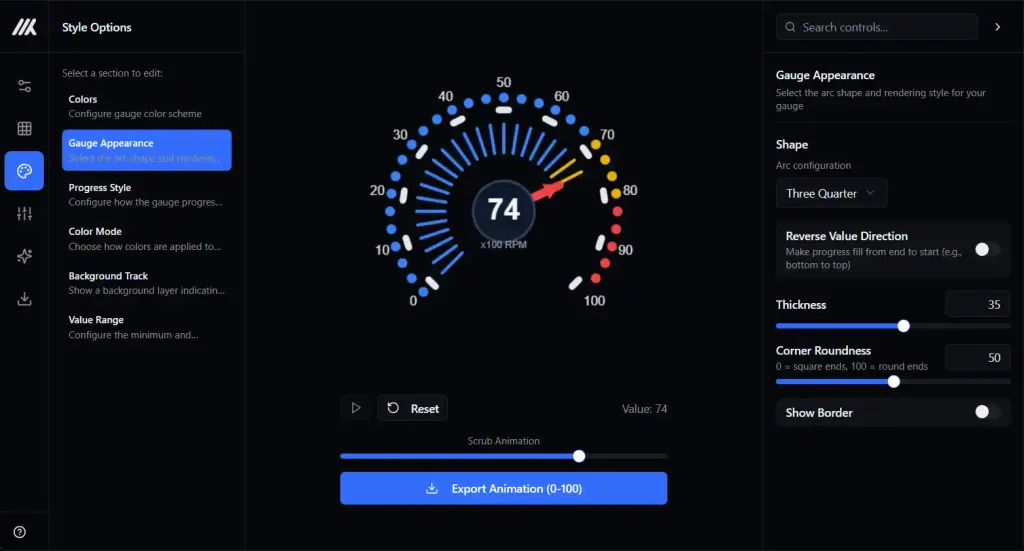
Arc Gauges
Classic circular gauges with a rotating needle. These are ideal for:
CPU, GPU, and memory usage
Temperature or pressure readings
Network throughput
Any value that feels natural on a dial
You can choose full circles, half arcs, or three-quarter layouts, and customize everything from tick marks to needle style and color.
Bar Gauges
Straightforward horizontal or vertical progress bars, perfect for:
Resource usage
Disk space or memory consumption
Download and process progress
Simple percentage-based indicators
Bars can fill in different directions and support patterns like stripes, dots, or icon-based fills (battery, hearts, blocks, and more).
Grid Matrix Gauges
A grid of cells that fill based on the current value. These work well for:
Activity indicators
Network traffic visualization
Multi-core or multi-process displays
Abstract or stylized data representations
You can control how the grid fills—sequentially, randomly, or with animated activity patterns.
Liquid Fill Gauges
A container that fills with animated liquid. These are great for:
Tank or capacity levels
Creative or playful progress indicators
Eye-catching loading animations
The liquid effect includes smooth motion and wave animations that respond naturally to changing values.
Score Gauges
Segmented gauges with defined ranges and labels. Ideal for:
Health or status scores
Performance ratings
Quality indicators
Metrics with clear thresholds or zones
Each segment can have its own color and label, making it easy to communicate meaning at a glance.
Fine-Grained Customization
Once you've chosen a gauge type, you have full control over how it looks and behaves.
Size and Layout
Canvas sizes from 10 to 1080 pixels
Optional aspect-ratio locking
Adjustable thickness, spacing, and corner rounding
Colors and Visual Effects
Solid colors or multi-stop gradients
Shadows with configurable blur and offset
Value-based color changes (for example: green → yellow → red)
Needles and Indicators
More than 10 needle styles
Adjustable size, shape, and color
Customizable needle bases and anchors
Labels and Text
Configurable tick marks and intervals
Optional value labels and range labels
Full control over font size and color
Backgrounds and Borders
Transparent or colored backgrounds
Optional canvas and gauge borders
Control over every visible element
Built-In Presets
If you don't want to start from scratch, the builder includes over 60 presets grouped by category:
Automotive – speedometers, fuel gauges, tachometers
Industrial – pressure meters, temperature gauges, load indicators
Minimal – clean rings, outlines, and subtle progress bars
Decorative – neon styles, glow effects, colorful gradients
Gaming – health bars, energy meters, pixel-style indicators
Loading – stripes, dots, chevrons, animated patterns
Pick a preset, tweak a few settings, and you're usually 90% of the way there.
How It Works
The workflow is intentionally simple:
Choose a gauge type
Start from a preset or a blank canvas
Adjust colors, sizes, and effects
Watch the preview update in real time
Scrub through values from 0–100%
Export when everything looks right
The live preview lets you test how the gauge behaves across the full range before exporting, so there are no surprises later.
Exporting Your Gauge
When you're finished, the builder exports a ready-to-use animation:
101 PNG images — one frame for each percentage (0–100)
Transparent backgrounds — easy to layer over any UI
ZIP download — all frames neatly packaged
These frames can be used in system monitoring dashboards like InfoPanel, game engines, video editors, web animations, or any environment that supports image sequences.
No Design Skills Required
You don't need to be a designer to use the Gauge Builder. Everything is visual, labeled clearly, and updates instantly. If you're unsure where to begin, a preset will get you started in seconds.
The tool takes care of the technical details—rendering, animation frames, export structure—so you can focus on how the gauge should look and feel.
In Short
Five flexible gauge types
Deep visual customization
60+ ready-made presets
Real-time preview and scrubbing
Exportable 0–100% PNG animations
Runs entirely in the browser
Transparent, production-ready output
Try It Yourself
If you want full control over how your gauges look—without relying on stock assets—the Gauge Builder is built for that.
Start with a preset, experiment freely, and export exactly what your project needs.
Ready to try it? Launch the Gauge Builder